Using DebugBar in FileMaker for IE WebViewer
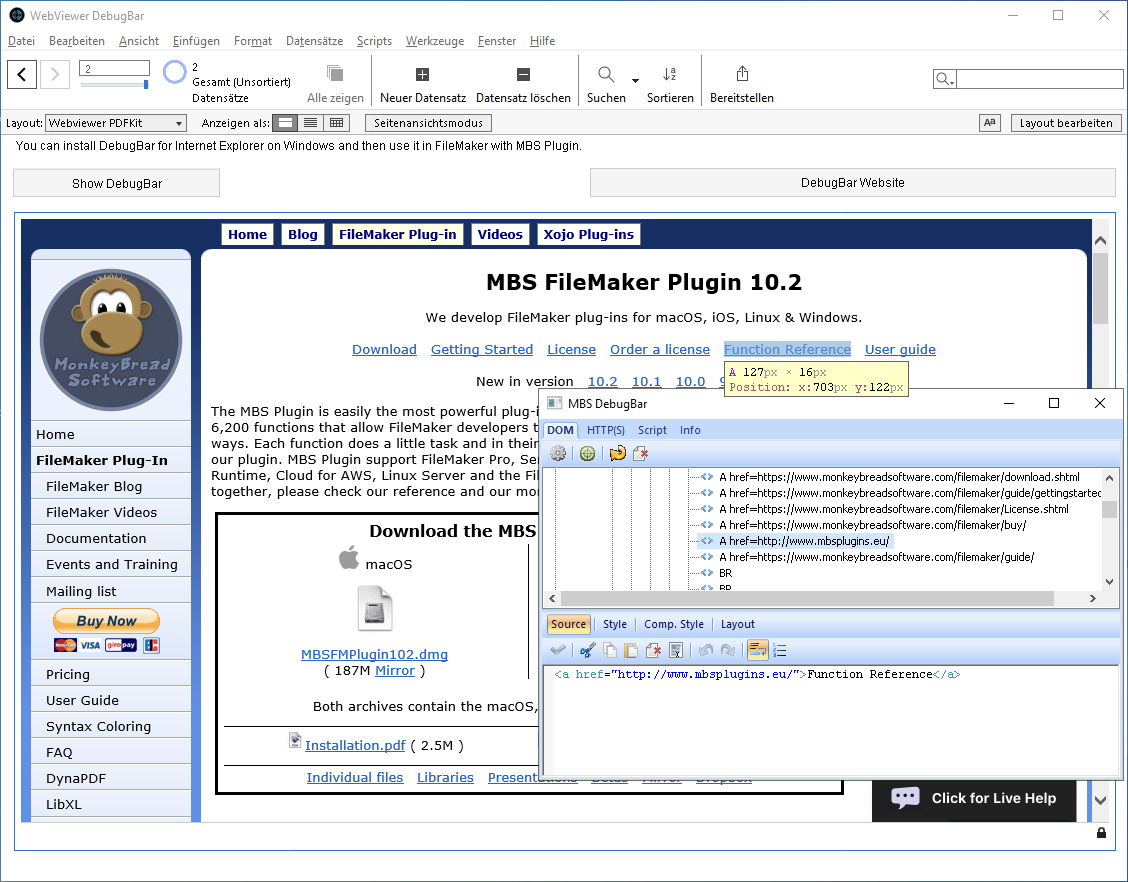
For MBS FileMaker Plugin 10.3 we add the new WebView.ShowDebugBar function. Our plugin will look for the web view in the FileMaker window, then create a new window and host there the DebugBar component. Looks like this:

We have four tabs there. The first one allows you to inspect the DOM and you can use the green picker to select an element on the web site. If you move the mouse over one of the elements in the DOM tree, the element highlights on the website. You can also inspect styles and modify all in the text field below.
The HTTPs tab currently doesn't work, so check the Script tab, where you can see all JavaScripts, adjust them and execute some JavaScript right in the window. See screenshot below:

There are a few issues and we'll see if we can resolve a few with the developers from DebugBar to make this as useful as possible for you. And they certainly appreciate if you buy a DebugBar license.
See DebugBar website Download Features Order
Please don't hesitate to contact us with your questions.