New ChartDirector Control

This control is based on a Canvas and 100% REALbasic code. Except for the ChartDirector classes it uses (and a few other plugin functions). Feel free to improve it and use it in your own applications.
- You need to place it on your window and give a CDBaseChartMBS object back from the Render event. Here you setup your chart and add the data and all the things you want to use.
- You should respect the current size of the canvas. In order to support zooming and moving with the mouse, you may want to check the viewport for the current drawing area.
- We have code to handle the UI. You can zoom in with option-click and zoom out with shift-click. You can move the visible area with the mouse.
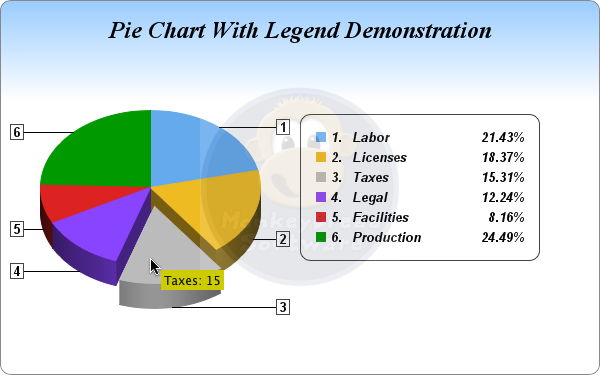
- If the mouse cursor is over an data point, we show a little popup with the value.
- You can decide to have a border around the control drawn in the canvas. Or you add your own border using the Chart. As you see in the picture above ChartDirector supports rounded borders.
- If you like, you can use the overlay property to add an image over the chart like a watermark.
- You can get the current picture at any time to save it to a file.
- Pictures can be rendered at higher resolution. Your render event must support the scale factor parameter.
- You can print charts.
- Live resizing is supported.
- You can let the chart redraw itself if dataset changes.
